
1. eBPF Engineering Template
This tutorial uses https://github.com/haolipeng/libbpf-ebpf-beginer
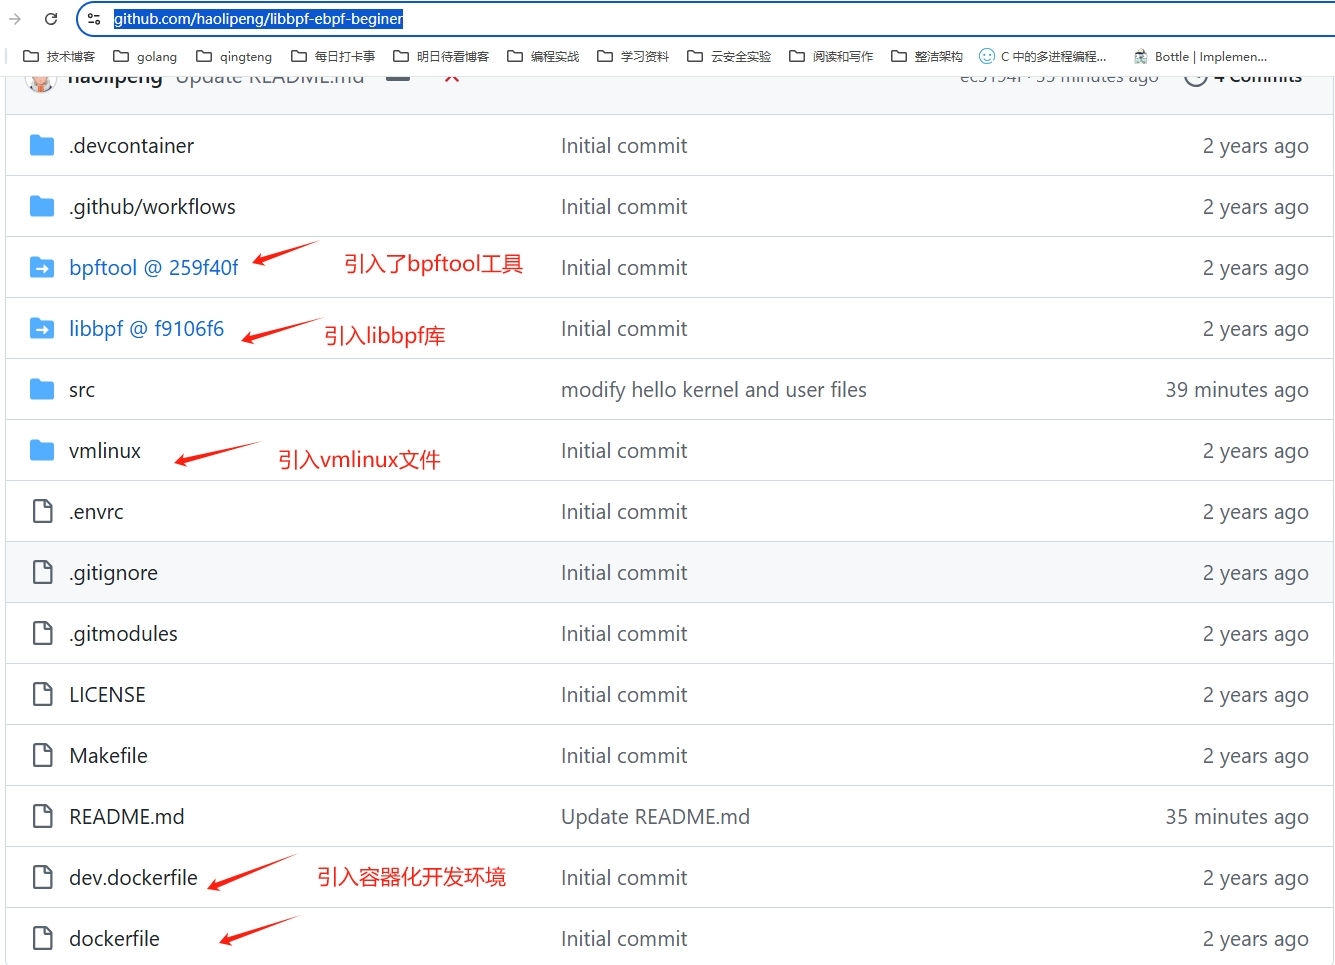
This template naturally integrates libbpf, bpftool, vmlinux, and other essential components for developing eBPF programs. As eBPF developers, we only need to focus on the src source code directory.
eBPF code is divided into kernel space and user space components.
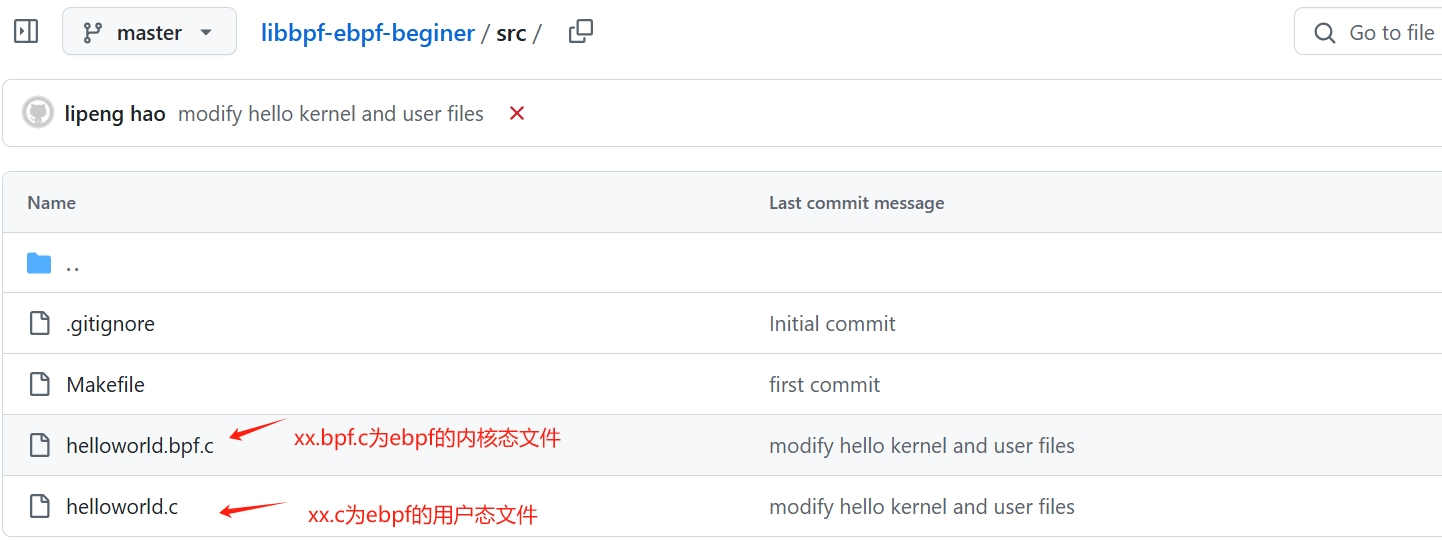
helloworld.bpf.cis the eBPF kernel space filehelloworld.cis the eBPF user space file
Why not use the eunomia-bpf development tool?
Eunomia-bpf abstracts away many details on the user space side. Since there are essential BPF concepts you need to learn anyway, it's better to face these challenges directly.
2. eBPF Kernel Space Programming
#include "vmlinux.h"
#include <bpf/bpf_helpers.h>
#include <bpf/bpf_tracing.h>
#include <bpf/bpf_core_read.h>

char LICENSE[] SEC("license") = "Dual BSD/GPL";

// Define a u32 type
typedef unsigned int u32;
typedef int pid_t;

// Create an array with 1 element to pass values between user space and kernel space
struct {
	__uint(type, BPF_MAP_TYPE_ARRAY);
	__uint(max_entries, 1);
	__type(key, u32);
	__type(value, pid_t);
} my_pid_map SEC(".maps");

// Define a tracepoint that triggers when a process executes the write system call
SEC("tp/syscalls/sys_enter_write")
int handle_tp(void *ctx)
{
	u32 index = 0;
	pid_t pid = bpf_get_current_pid_tgid() >> 32;
	pid_t *my_pid = bpf_map_lookup_elem(&my_pid_map, &index);

	if (!my_pid || *my_pid != pid)
		return 1;

	bpf_printk("BPF triggered from PID %d.\n", pid);

	return 0;
}
Question 1: What does SEC do?
- Defines the type and loading location of the eBPF program
- Specifies which kernel hook point the program should be attached to
Question 2: How to interpret SEC("tp/syscalls/sys_enter_write")?
In SEC("tp/syscalls/sys_enter_write"):
tpindicates this is a tracepoint type BPF program (there are also kprobe and uprobe types that we'll learn later)syscallsis the tracepoint category/subsystemsys_enter_writeis the specific tracepoint name, indicating it captures the entry point of the write system call
This definition means the BPF program will be triggered every time a write system call occurs, allowing you to monitor and analyze all write operations in the system.
Question 3: How to look up these hook points when writing code?
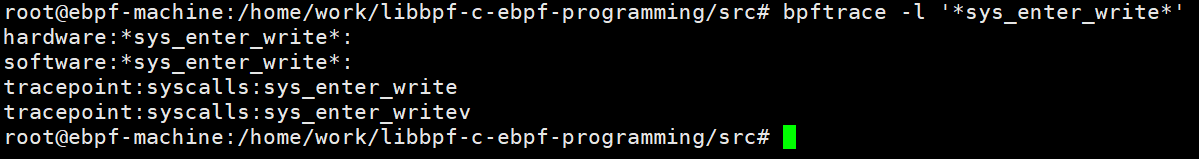
I recommend a very useful eBPF tool: bpftrace.
# Query all kernel probes and tracepoints
sudo bpftrace -l

# Use wildcards to query all system call tracepoints
sudo bpftrace -l 'tracepoint:syscalls:*'
Using bpftrace to view the sys_enter_write function tracepoint, as shown below:
3. eBPF User Space Programming
#include <stdio.h>
#include <unistd.h>
#include <sys/resource.h>
#include <bpf/libbpf.h>
#include "helloworld.skel.h"

static int libbpf_print_fn(enum libbpf_print_level level, const char *format, va_list args)
{
	return vfprintf(stderr, format, args);
}

int main(int argc, char **argv)
{
	struct helloworld_bpf *skel;
	int err;
	pid_t pid;
	unsigned index = 0;

	// Set libbpf strict mode
	libbpf_set_strict_mode(LIBBPF_STRICT_ALL);

	// Set libbpf print function
	libbpf_set_print(libbpf_print_fn);

	// Open BPF program, returns the skeleton object
	skel = helloworld_bpf__open();
	if (!skel) {
		fprintf(stderr, "Failed to open and load BPF skeleton\n");
		return 1;
	}

	// Load and verify BPF program
	err = helloworld_bpf__load(skel);
	if (err) {
		fprintf(stderr, "Failed to load and verify BPF skeleton\n");
		goto cleanup;
	}

	// Ensure BPF program only processes write() system calls from our process
	pid = getpid();
	err = bpf_map__update_elem(skel->maps.my_pid_map, &index, sizeof(index), &pid, sizeof(pid_t), BPF_ANY);
	if (err < 0) {
		fprintf(stderr, "Error updating map with pid: %s\n", strerror(err));
		goto cleanup;
	}

	// Attach BPF program to tracepoint
	err = helloworld_bpf__attach(skel);
	if (err) {
		fprintf(stderr, "Failed to attach BPF skeleton\n");
		goto cleanup;
	}

	// After successful execution, print tracepoint output logs
	printf("Successfully started!\n");
	system("sudo cat /sys/kernel/debug/tracing/trace_pipe");

cleanup:
	// Destroy BPF program
	helloworld_bpf__destroy(skel);

	return err < 0 ? -err : 0;
}
The workflow for writing eBPF code in user space follows a fixed pattern:
1. Include necessary header files Include eBPF-related header files such as <bpf/libbpf.h> and the auto-generated BPF skeleton header file, like "helloworld.skel.h" in the example code.
For example, if your user space file is named helloworld.c and the kernel space file is helloworld.bpf.c, the generated skeleton header file will be named helloworld.skel.h. Moreover, all APIs inside follow the same naming convention based on "helloworld".
2. Configure the libbpf library Typically set libbpf's strict mode and print function for easier debugging and error handling. The example code uses libbpf_set_strict_mode(LIBBPF_STRICT_ALL) and libbpf_set_print(libbpf_print_fn) to accomplish this.
3. Open BPF object Use the <object>_bpf__open() function to open the BPF object defined in the auto-generated BPF skeleton header file. The example code uses helloworld_bpf__open() for this step.
4. Load and verify BPF program Call the <object>_bpf__load(skel) function to load and verify the BPF program. The example code uses helloworld_bpf__load(skel) for this step.
5. Attach BPF program to a hook point Call the <object>_bpf__attach(skel) function to attach the BPF program to specified event sources, such as kprobe, uprobe, tracepoint, etc. The example code uses helloworld_bpf__attach(skel) to attach the BPF program to a tracepoint.
6. Trigger events and observe output Execute some operations to trigger the attached BPF program and observe the output. The example code uses system("sudo cat /sys/kernel/debug/tracing/trace_pipe") to view tracepoint output logs.
7. Cleanup and release resources Before program exit, call the <object>_bpf__destroy(skel) function to destroy and release the BPF object. The example code uses helloworld_bpf__destroy(skel) for this step.
4. Compilation, Execution, and Result Verification
4.1 Compilation Steps
Execute directly in the project root directory:
1. Project compilation - libbpf library compilation
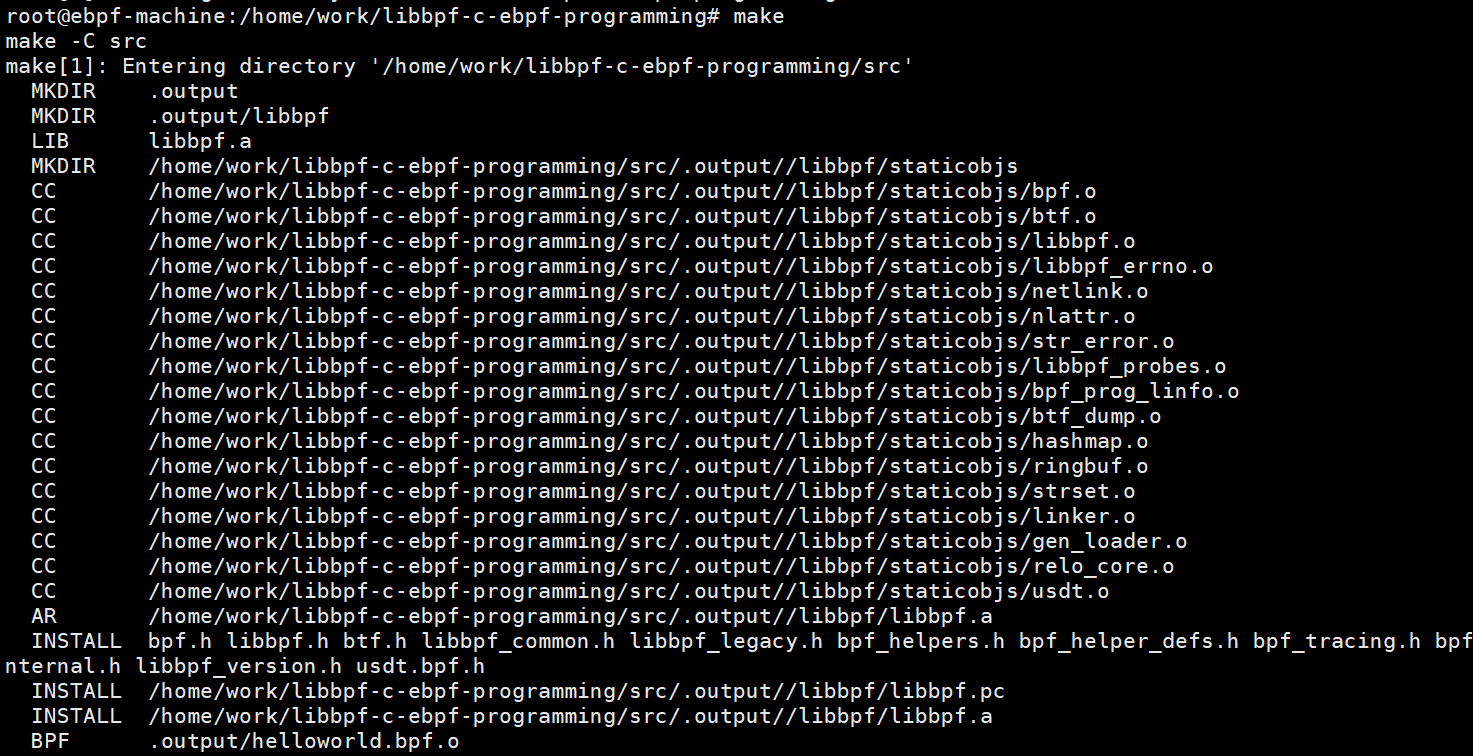
2. Project compilation - bpftool library compilation
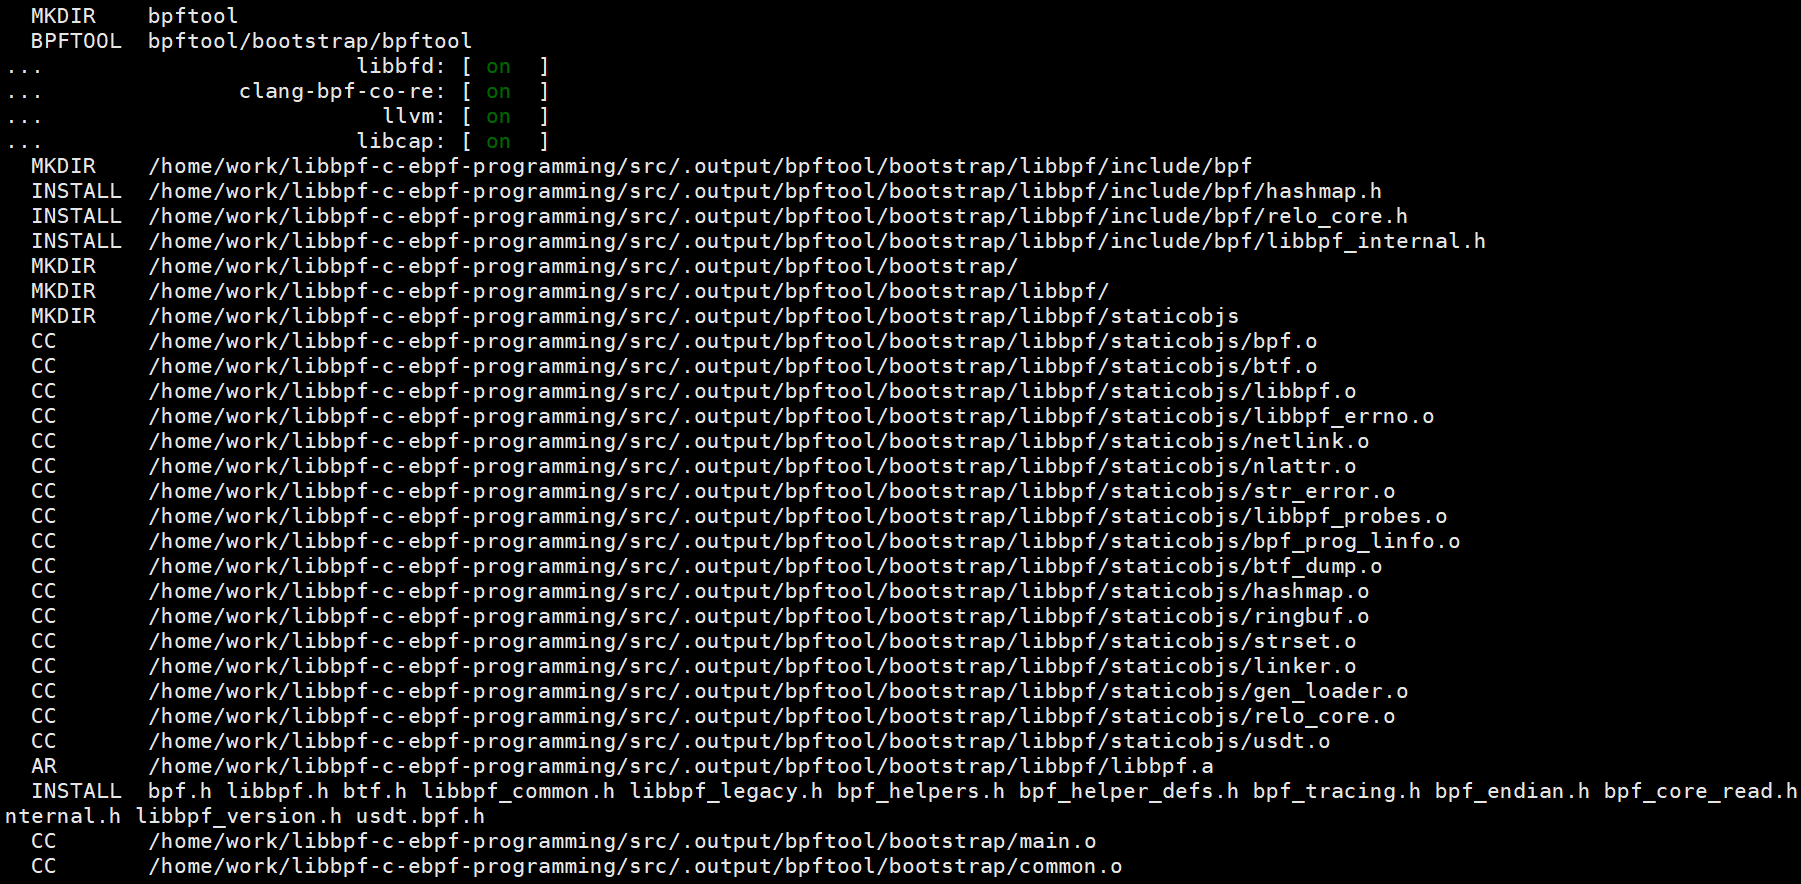
3. Project compilation - eBPF program code compilation
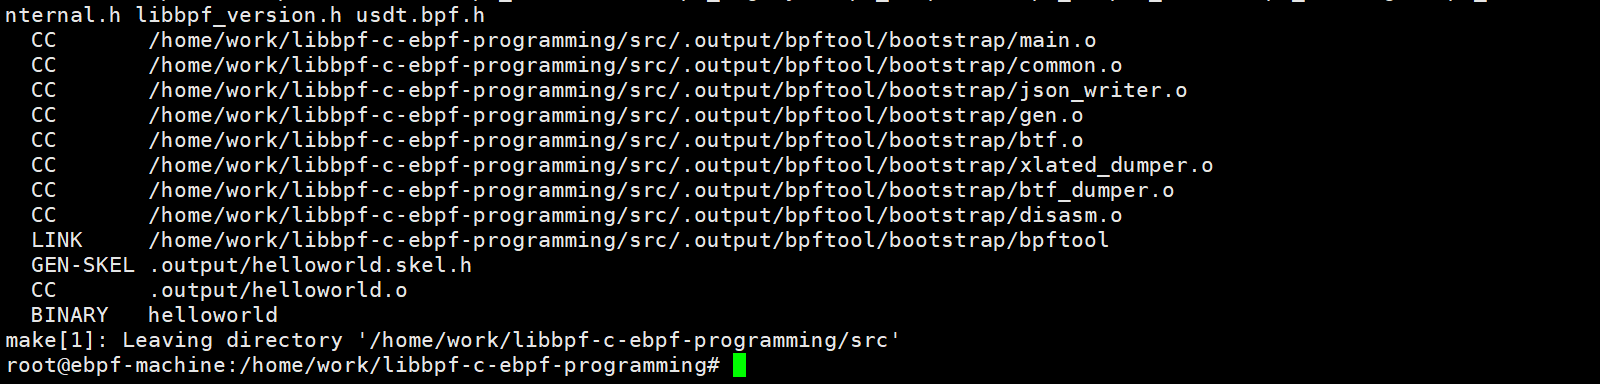
After successful compilation, an executable program named helloworld will be generated in the src directory.
4.2 Execution Results
After running the program in the src directory, you can see the program running normally.
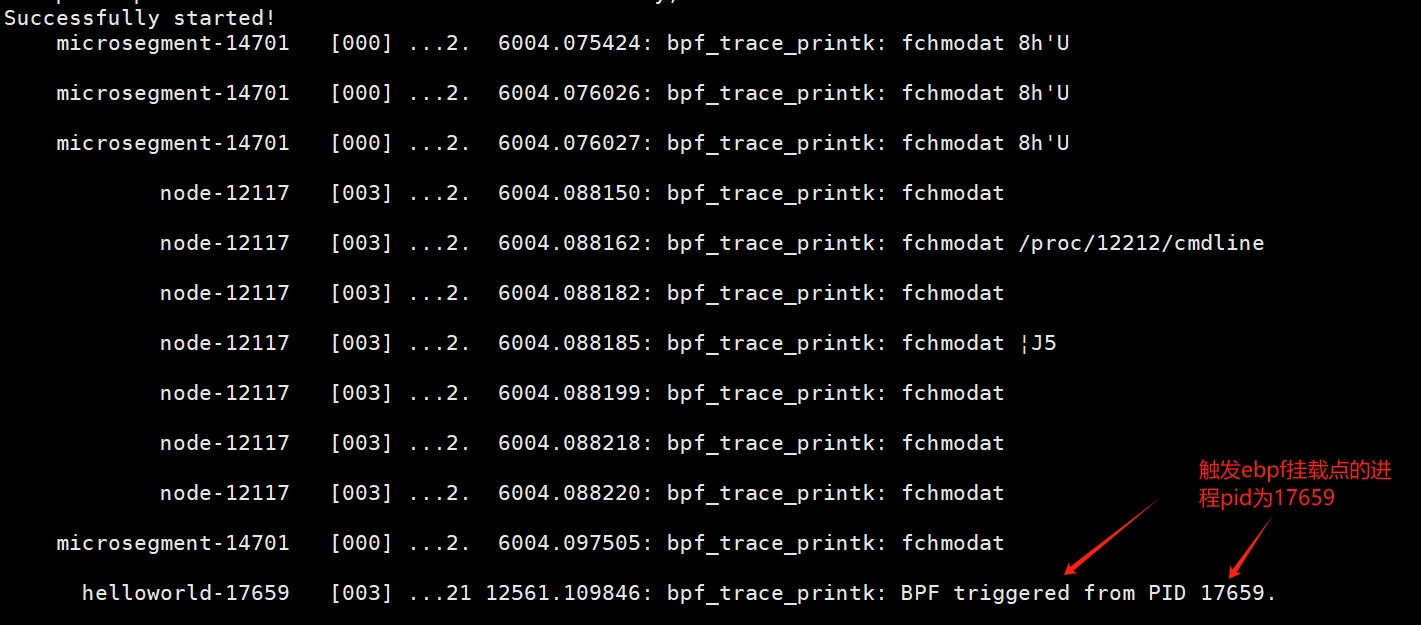
Check the process PID of the helloworld program, which is 17659:

Where can you view the output results of the eBPF program?
5. Related Resources
Ready-to-use virtual machine or container environment.
Project source code repository:
https://github.com/haolipeng/libbpf-ebpf-beginer/blob/master/src/helloworld.bpf.c
https://github.com/haolipeng/libbpf-ebpf-beginer/blob/master/src/helloworld.c